Making choropleth maps by zip code
Every now and then it is useful to make a map. In times of political uncertainty, data can light a path forward. Your local elected officals may be interested in data, too, and how they impact policy (and re-election, of course).
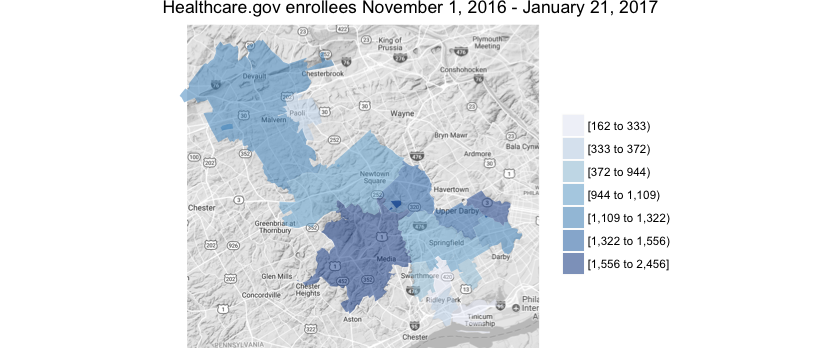
Let’s say you wanted to know if people are still enrolling the Healthcare.gov plans in your local State Senatorial district. It’s quite difficult to find data broken up at this level but zip codes can approximate such an approach. Here’s information from Pennsylvania 26th Senatorial District.
Marketplace enrollment
Using publicly available data from the Centers for Medicare & Medicaid Services, this file includes data by zip code on enrollment through HealthCare.gov The data description reads:
“2017 OEP ZIP Code-Level Public Use File: This ZIP code and APTC PUF includes total health plan selections, the count of consumers with APTC, and average APTC among consumers with APTC between November 1, 2016 and January 31, 2017. This PUF only includes data for the 39 states that used the HealthCare.gov platform in 2017.”
# setup
require(zipcode)
library(readxl)
require(dplyr)
require(choroplethrZip)
require(magrittr)


data(zipcode)
# download and extract this file: https://www.cms.gov/Research-Statistics-Data-and-Systems/Statistics-Trends-and-Reports/Marketplace-Products/Plan_Selection_ZIP.html

dt <- read_excel('2017_OEP_ZIP_Code-Level_Public_Use_File.xlsx', sheet = 4)

# approximating the 26th district
zips_26thsenate <- c('19029', '19081', '19082', '19078', '19036', '19033',
                     '19070', '19018', '19026', '19064', '19063', '19008',
                     '19073', '19355', '19301', '19050')

dt %<>% select(ZipCode = 'ZIP Code',
               Enrollees = 'Total Number of Consumers Who Have Selected a Marketplace Plan') %>%
  mutate(Enrollees = as.integer(Enrollees)) %>%
  filter(ZipCode %in% zips_26thsenate) %>%
  left_join(zipcode, by = c('ZipCode' = 'zip'))
Summarize the results by zip:
dt %>%
  select(ZipCode, City = city, Enrollees) %>%
    arrange(desc(Enrollees)) %>%
    knitr::kable()
And plot the output:
zipmap <- dt %>%
  select(value = Enrollees, region = ZipCode) %>%
  zip_choropleth(zip_zoom = zips_26thsenate, reference_map = TRUE,
                 title = 'Healthcare.gov enrollees November 1, 2016 - January 21, 2017')

plot(zipmap)
Assistant Professor of Medicine and Informatics
I am a pulmonary and critical care physician at the University of Pennsylvania Perelman School of Medicine, and core faculty member at the Palliative and Advanced Illness Research (PAIR) Center. My work seeks to translate innovations in artificial intelligence methods into bedside clinical decision support systems that alleviate uncertainty in critical clinical decisions. My research interests include clinical informatics, artificial intelligence, natural language processing, machine learning, population health, and pragmatic trials.