The structure of twitter participant relationships in conversations around #Libya, #Bieber, and #Rstats
Here’s the blog post originally posted on babelgraph.org on April 4, 2011. I suspect the twitter API and much of the code below are not up to date.
I am a recent comer to twitter, and it took me a few weeks to figure out what this was all about. Who are all these people tweeting each other and what do all these trending hashtags mean? Do these people all know each other? How do they get involved in these conversations? Are people really talking/listening to each other, or just spewing 140 character projectiles out into the void?
This piqued my interest in the structure of relationships of participants in different twitter conversations. Using R, with the twitteR and igraph packages, I wondered what I would find…
In terms of mapping twitter networks with R, I found this post for mapping one’s own personal network of connections. For other visualizations, I found a collection of various visualizations for the twitterverse, and an interactive map of connected users.
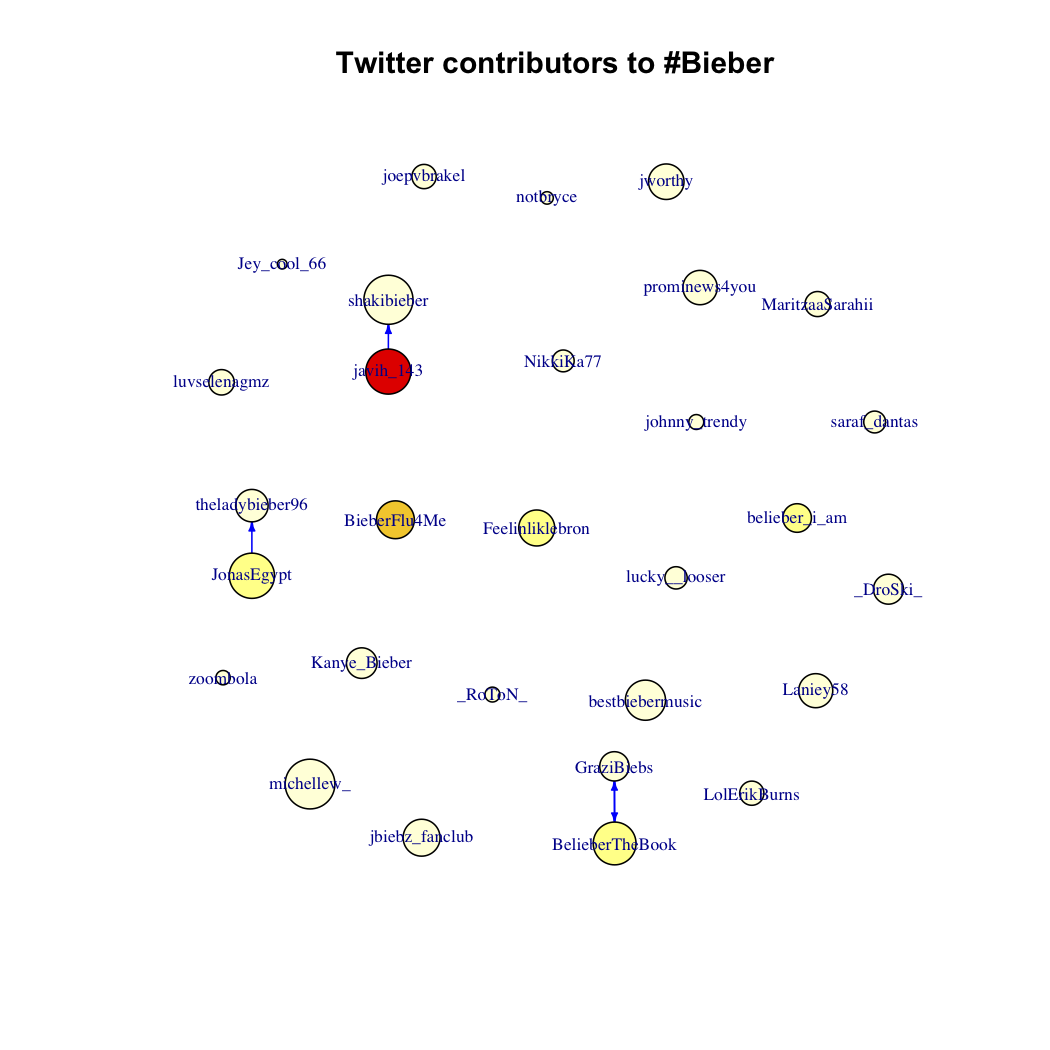
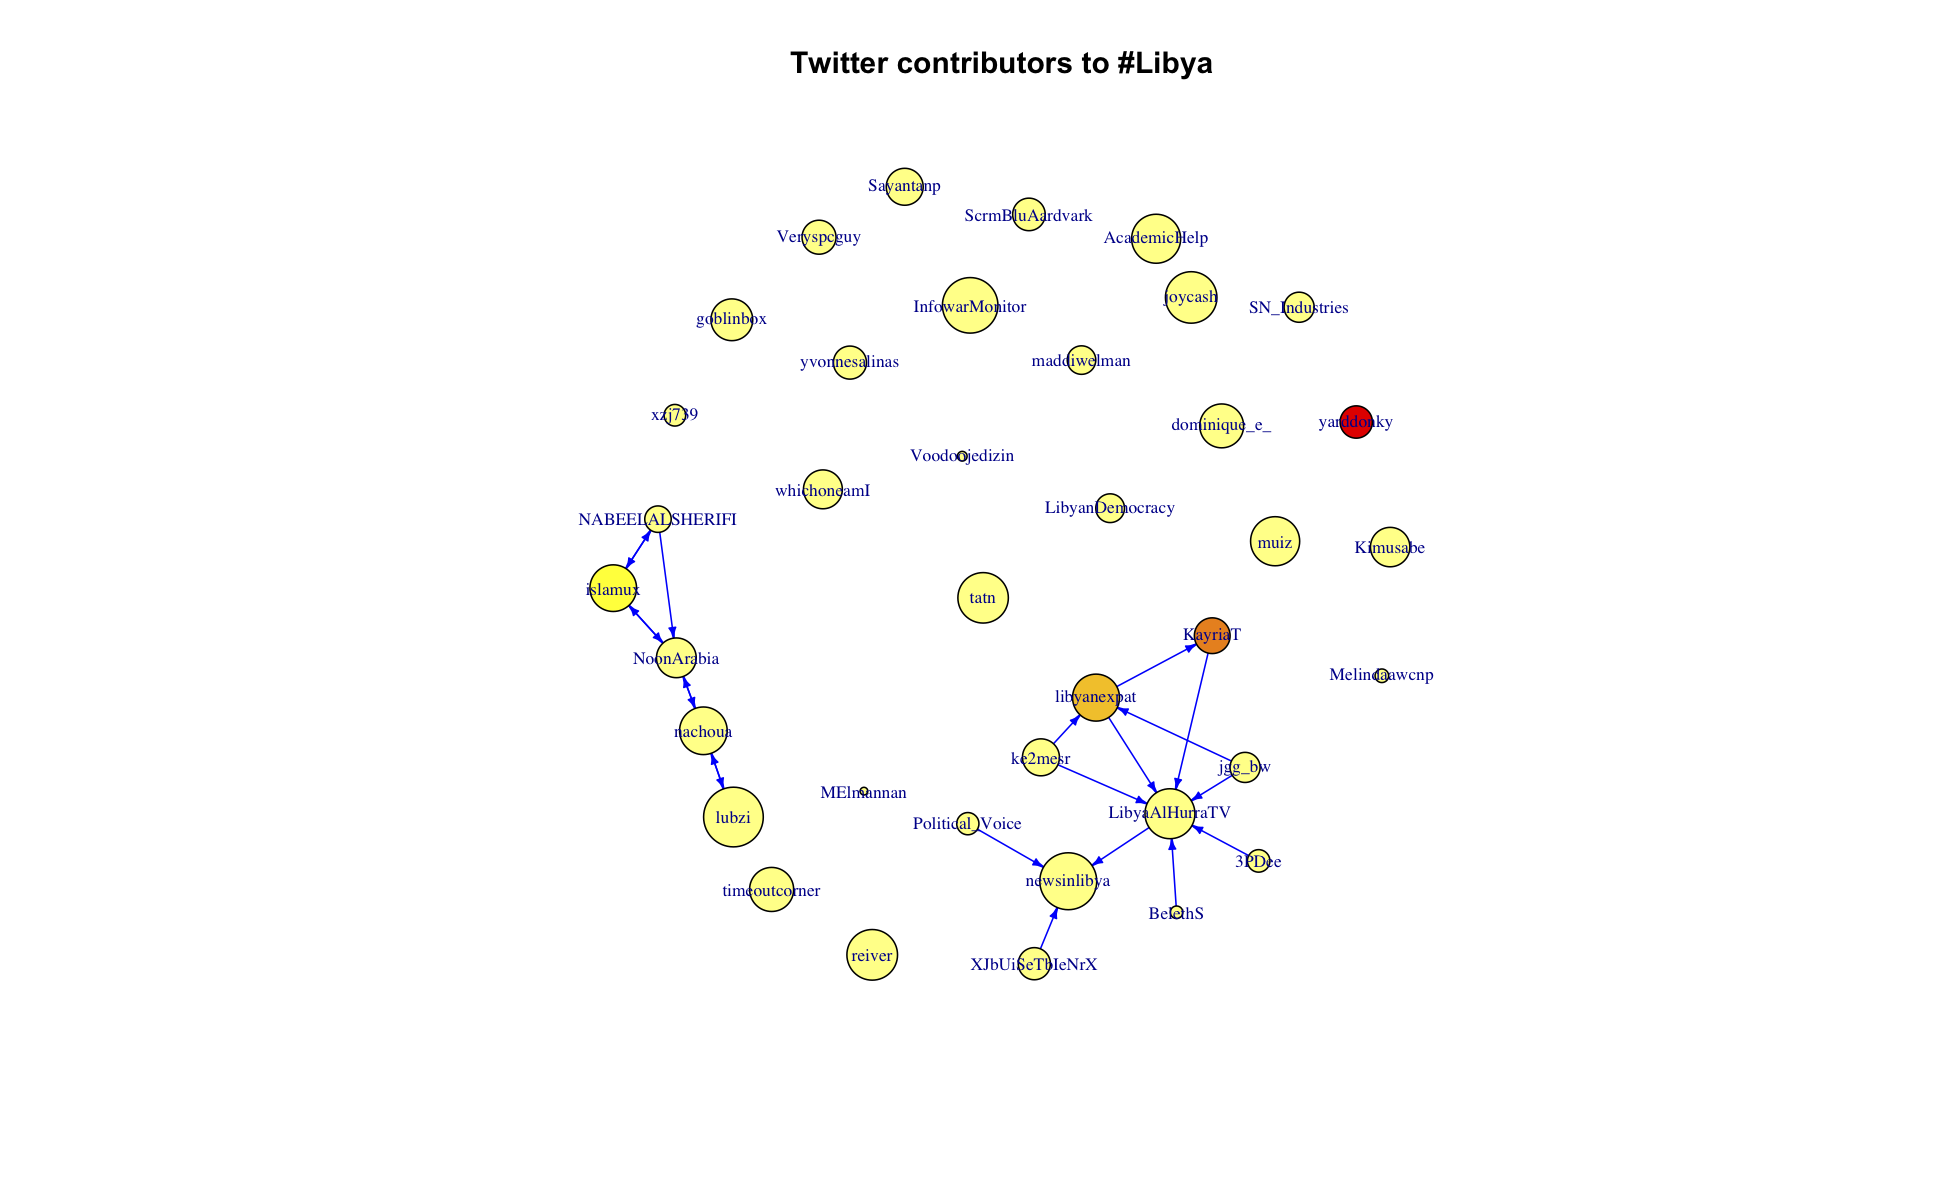
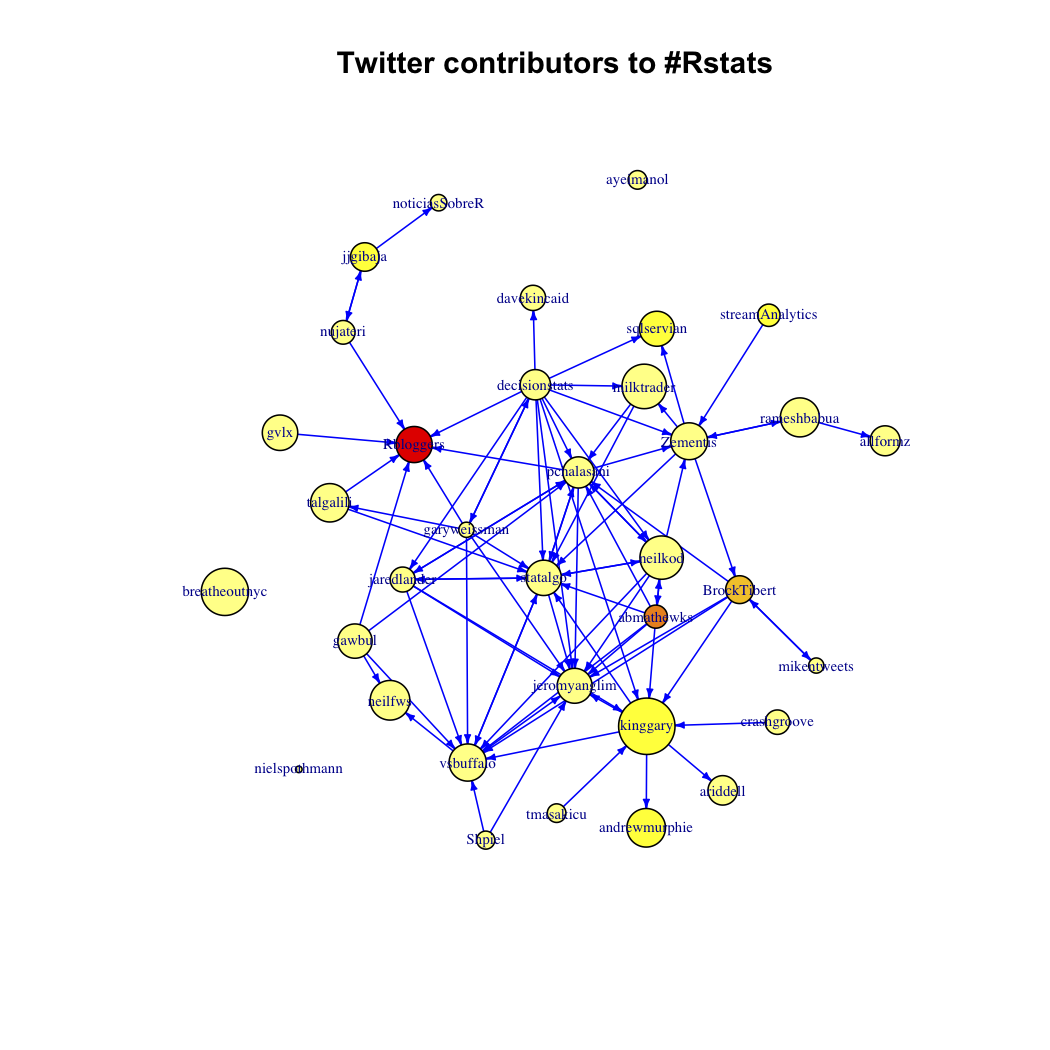
Here I am really interested in the network of participants in a particular conversation. I started off with “#Rstats,” expecting to see a tightly knit community of users who all seem to know each other (at least virtually), sending each other personal updates or tech support tweets. Next I looked at “#Libya,” where I imagined there would be a lot of twitterers with massive followings, but who were unlikely following each other, and producing hordes of news-type updates. Finally I looked at “#Bieber,” (I swear didn’t even know who he was up until a few weeks ago), where I expected to see platoons of small-time twitterers, who likely don’t follow each other, pouring out disconnected digital adulations into the twitterverse.
The following script was used to construct the networks for each search item.
# an R script to generate the social network of contributors
# to a particular search term
# author: Gary Weissman
# twitter: @garyweissman

# choose a conversation and size of search
search.term <- '#Rstats'
search.size <- 50

# load required libraries
library(igraph)
library(twitteR)

# get recent results from search
search.results <- searchTwitter(search.term,n=search.size)

# build the vertex list
vl <- vector()
for (twt in search.results)
  vl <- c(vl,screenName(twt))

# calculate contribution of each user in the conversation
vl <- as.data.frame(table(vl))

# provide nice names for data
colnames(vl) <- c('user','tweets')

# build the network of relations between contributors
g <- graph.empty(directed=TRUE)
g <- add.vertices(g,nrow(vl),name=as.character(vl$user),
      tweets=vl$tweets)

V(g)$followers <- 0 # default to zero

# count total number of followers in the larger twitterverse and
# add relationships based on who follows whom within the conversation
for (usr in V(g)) {

  # get the user info by name
  tuser <- getUser(V(g)$name[usr+1])
  print(paste("Getting info on",screenName(tuser)))

  # count total followers in larger twitterverse
  V(g)$followers[usr+1] <- followersCount(tuser)

  # access as many followers as we can to see if any
  # appeared in the search results
  followers.list <- userFollowers(tuser,n=1200)
  for (tflwr in followers.list) {
   if (screenName(tflwr) %in% V(g)$name)
    g <- add.edges(g,c(as.vector(V(g)[ name == screenName(tflwr) ]),usr))
  }
  print('Sleeping 10 min...')
  Sys.sleep(600); # don't exceed request limit
}

# layout the graph
g$layout <- layout.fruchterman.reingold(g)
# adjust size based on number of total followers
# scale accordingly to keep readable
V(g)$size = log( V(g)$followers ) * 1.8
# set label name and size
V(g)$label=V(g)$name
V(g)$label.cex = 0.6
# do something with color...
tcolors <- rev(heat.colors(max(V(g)$tweets)))
V(g)$color <- tcolors[ V(g)$tweets ]
# make edge arrows less intrusive
E(g)$arrow.size <- 0.3
# make symmetric connections a little easier to read
E(g)$curved <- FALSE # fun to play with
E(g)$color <- 'blue'
# now plot...
plot(g)
Technical notes: It wasn’t always clear to me what counted as a “request” in the twitter API, because even a small handful of requests with long results would sometimes seem to count as more toward the hourly quota. Putting a ten minute delay between requests with Sys.sleep(600) was enough to solve the problem. I also tweaked the layouts a bit using tkplot.getcoords(). NB. tkplot() does not permit certain graph attributes such as label.vertex.cex, so you have to remove it before opening the graph in tkplot. You can then just add it back later. More details on this tkplot issue here.
The size of the vertex is proportional to the log of the number of followers in the wider twitterverse, and the color of vertex represents the number of tweets found in the search results by that user. See code above for specifics.
#Bieber
#Libya
#Rstats
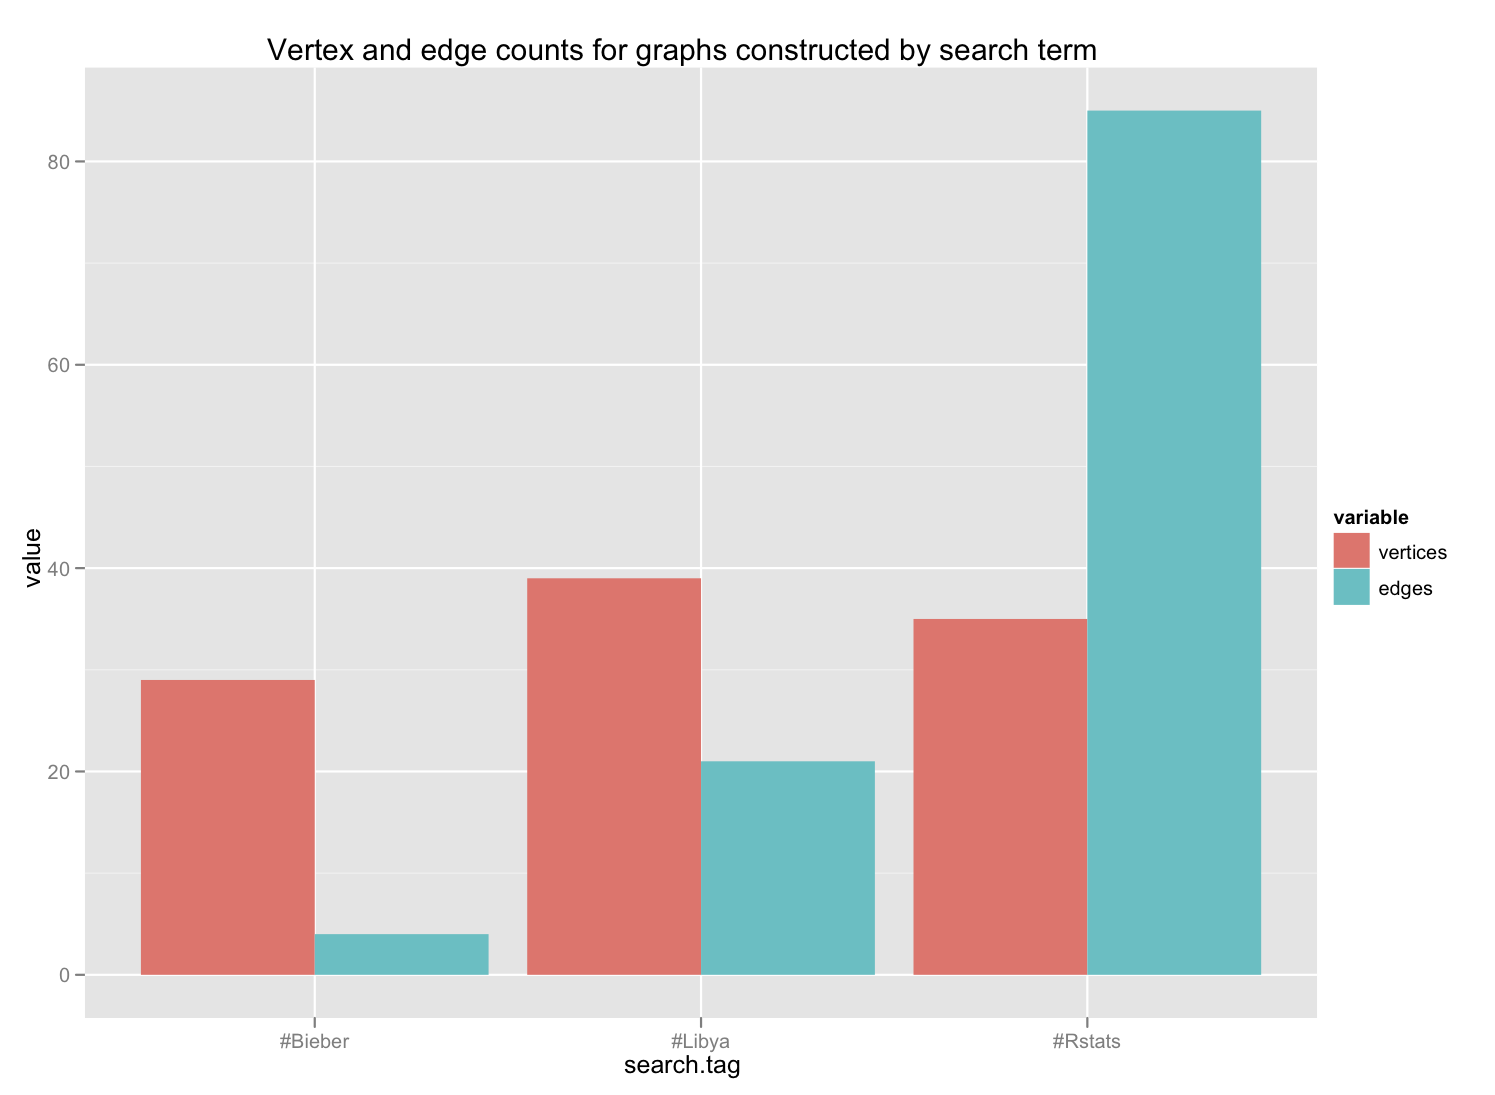
The networks obviously look very different. Here is a plot of the degree distribution of each graph:
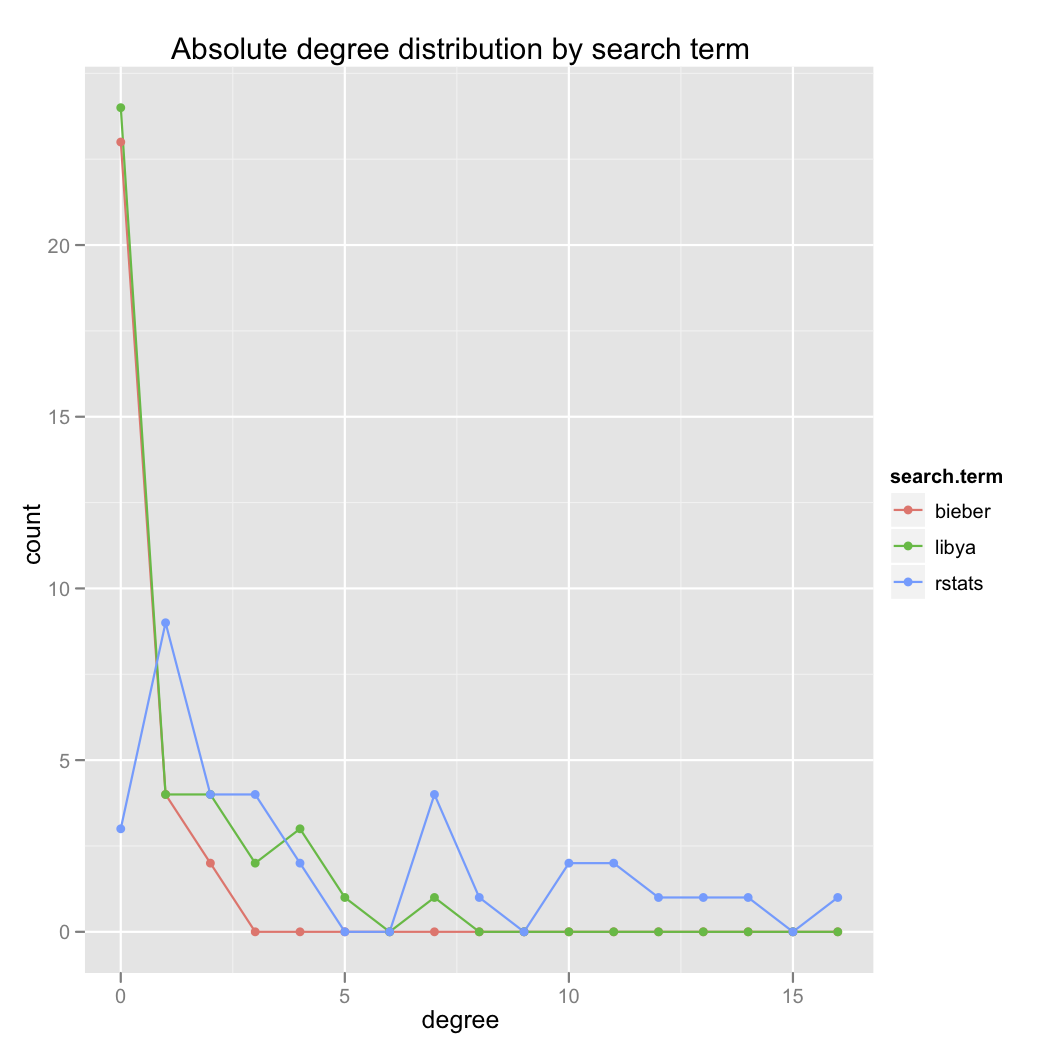
Even more interesting is the simple comparison of the number of edges in each graph. Very telling.
I did not look at the clustering coefficient here, but that would be interesting, too.
Does this mean that R users are part of a twitter community?
Limitations on this approach include the size of the user sample (limited by the twitter API to 150 requests per hour), as well as limits on the size of lists retrieved by the userFriends() method (I believe the limit is 1200 items). These former limits the sample size significantly, and provides only a brief snapshot in time of the participants in any one conversation. The latter favors the construction of edges between twitterers with fewer followers, thus understestimating the total edges that may exist in the network. Is there a workaround for these limitations on the API? I believe requesting whitelist status from twitter, or perhaps authenticating with ROAuth would increase the number of permitted requests, but I haven’t tried them yet.
Do you know to whom you tweet?
Assistant Professor of Medicine and Informatics
I am a pulmonary and critical care physician at the University of Pennsylvania Perelman School of Medicine, and core faculty member at the Palliative and Advanced Illness Research (PAIR) Center. My work seeks to translate innovations in artificial intelligence methods into bedside clinical decision support systems that alleviate uncertainty in critical clinical decisions. My research interests include clinical informatics, artificial intelligence, natural language processing, machine learning, population health, and pragmatic trials.